CAUTION: It is wise to check the date and time of the forecast product(s) since for one reason or another charts may not have been updated on this site.
As from early March 2008 the Met Office revised its output of MSLP forecast products.
In this revision the T+108 and T+132 based on 0000UTC data have been discontinued.
Currently the output now consists of MSLP analyses and 24-hour MSLP forecasts four times a day, the analyses being for 0000/0600/1200/1800 UTC.
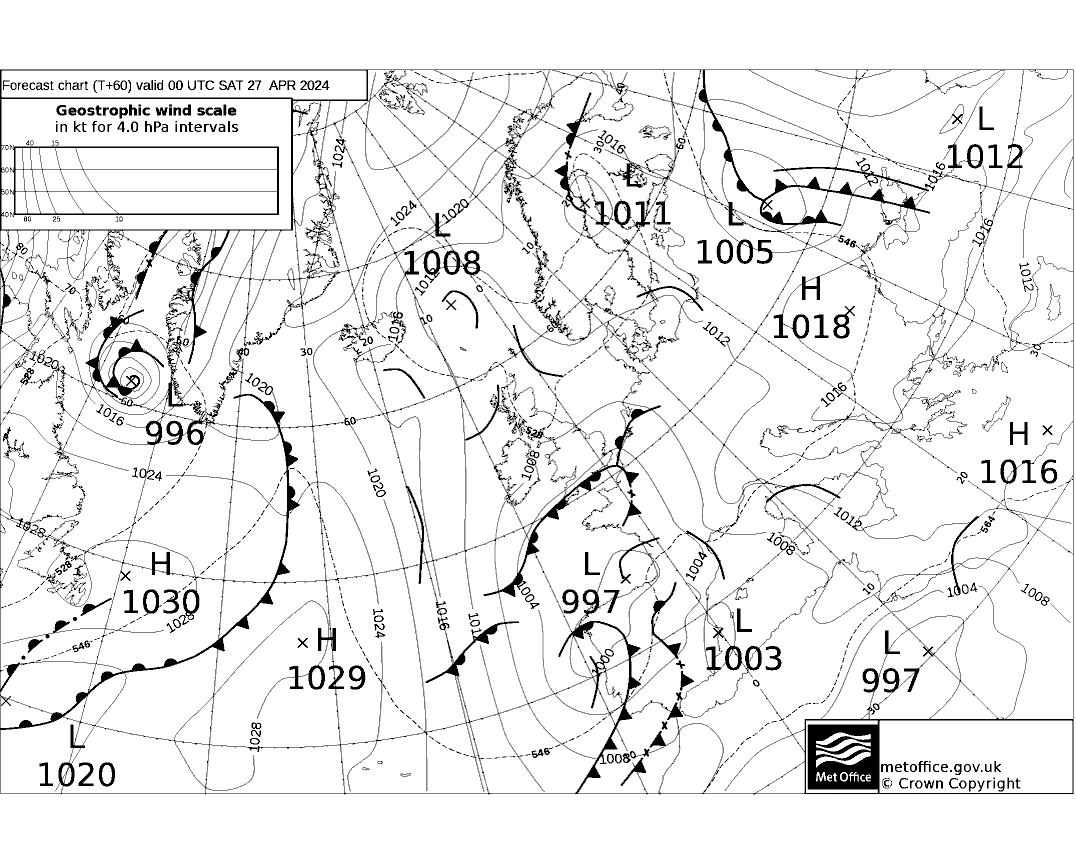
- MSLP products, T+36/48/60/72 hours are available twice a day based on data times of 0000 and 1200UTC.
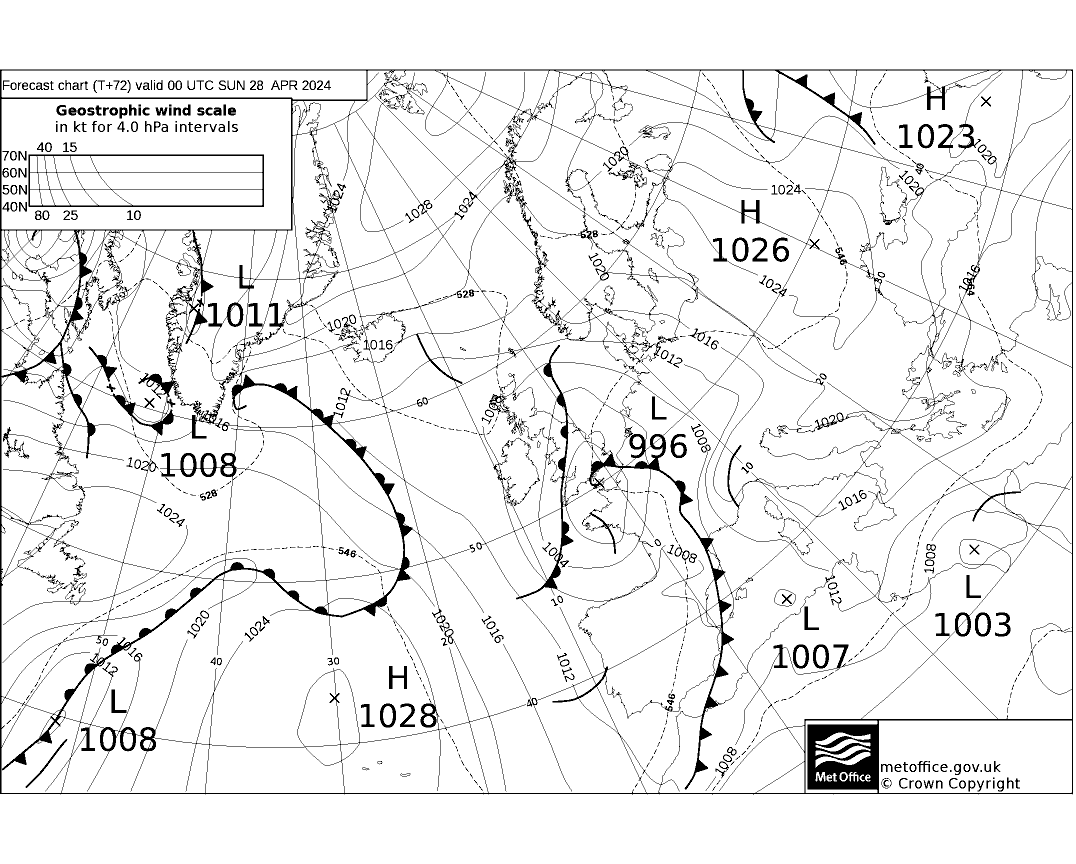
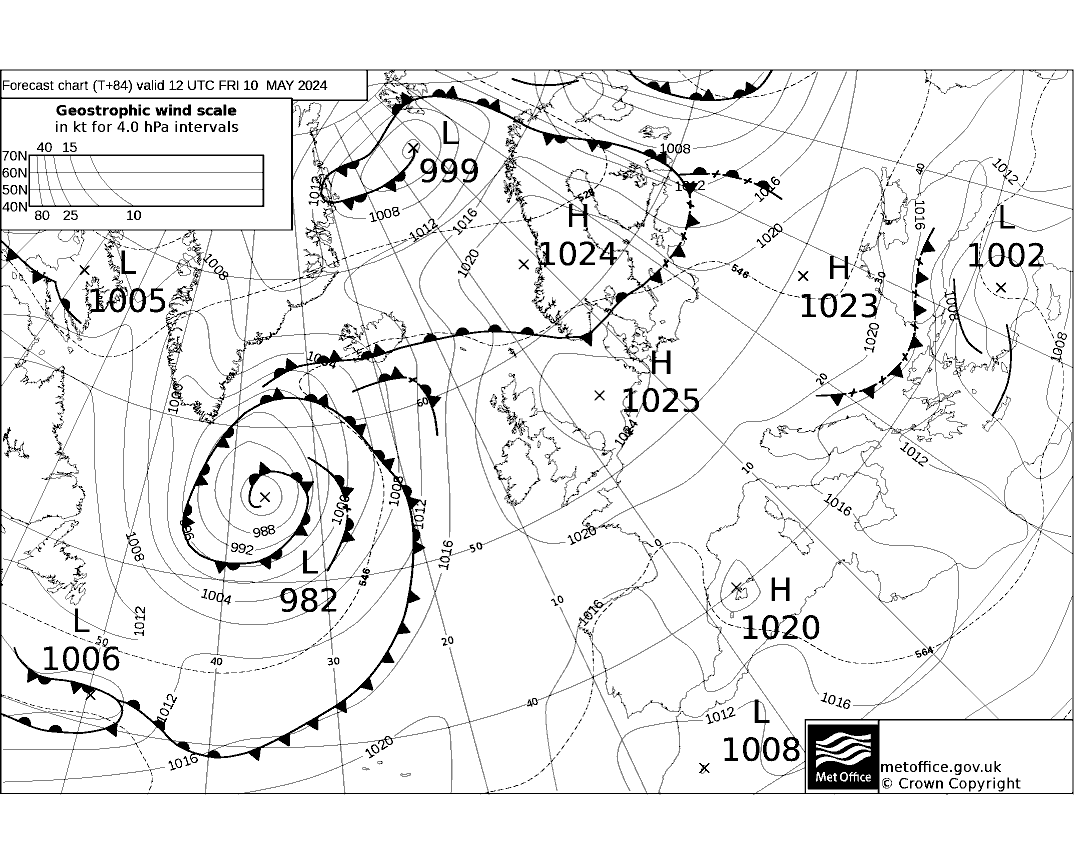
- MSLP products for T+84 (verifies at midday on Day 3) are available once a day in the late morning.
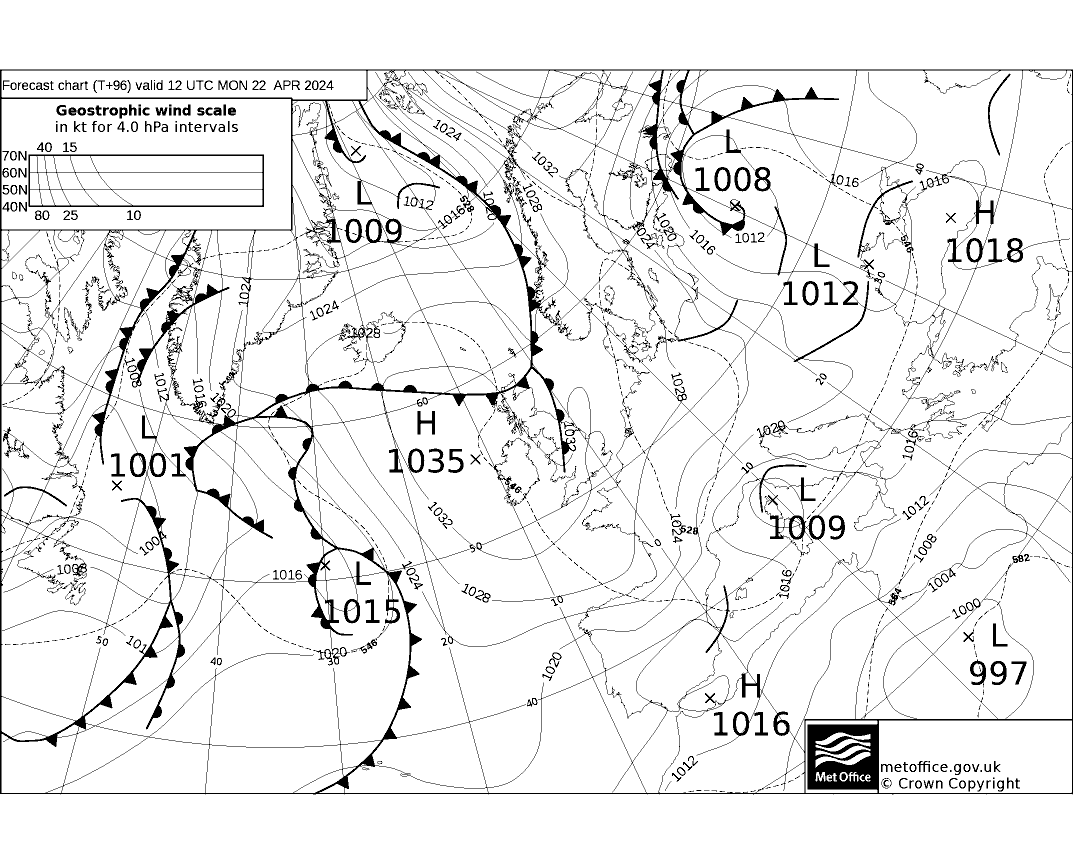
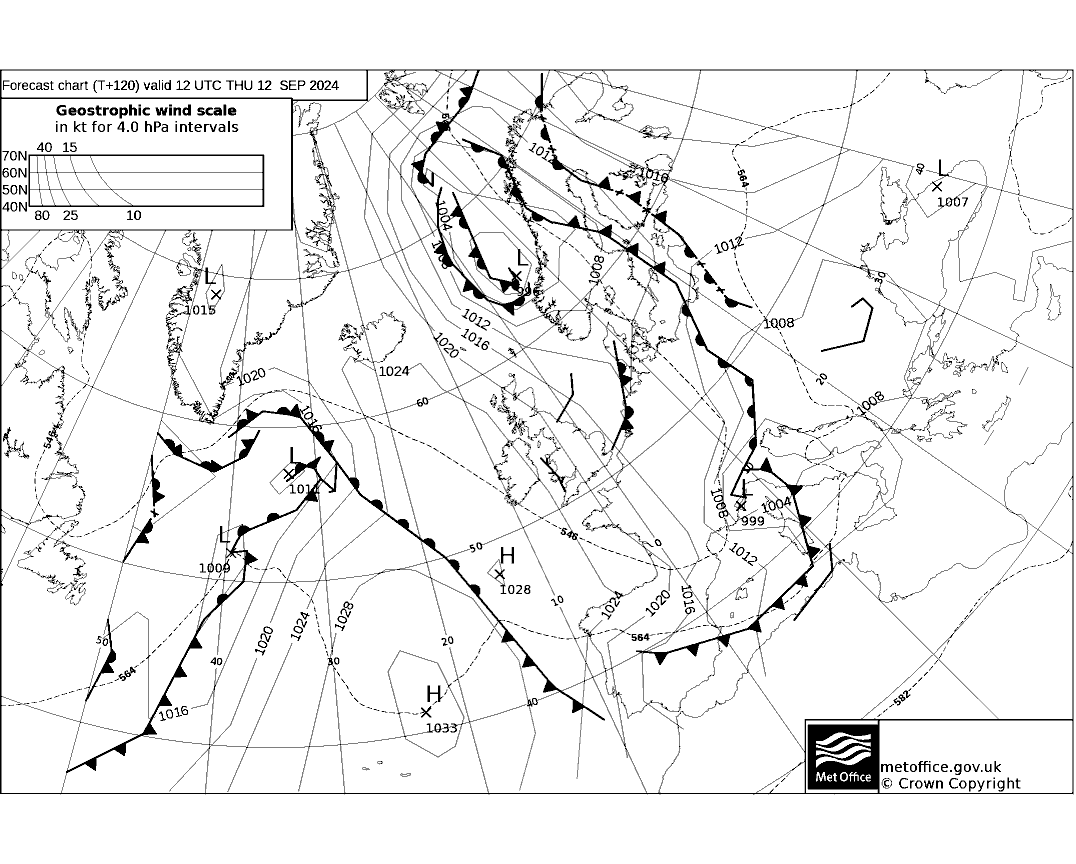
- MSLP products for T+96 and T+120 (verifies at midday on Days 4 and 5) available once a day in the late evening.
Please note that charts available on this server are only replaced when the later product becomes available.
Thus the set of charts below will be a mixture of forecasts based on different data times, that is based on both the current forecast run and the forecast run based on earlier data.
If you want to see the full sequence of charts on which the forecast product is based these are available in the UK section of the models page on this site.
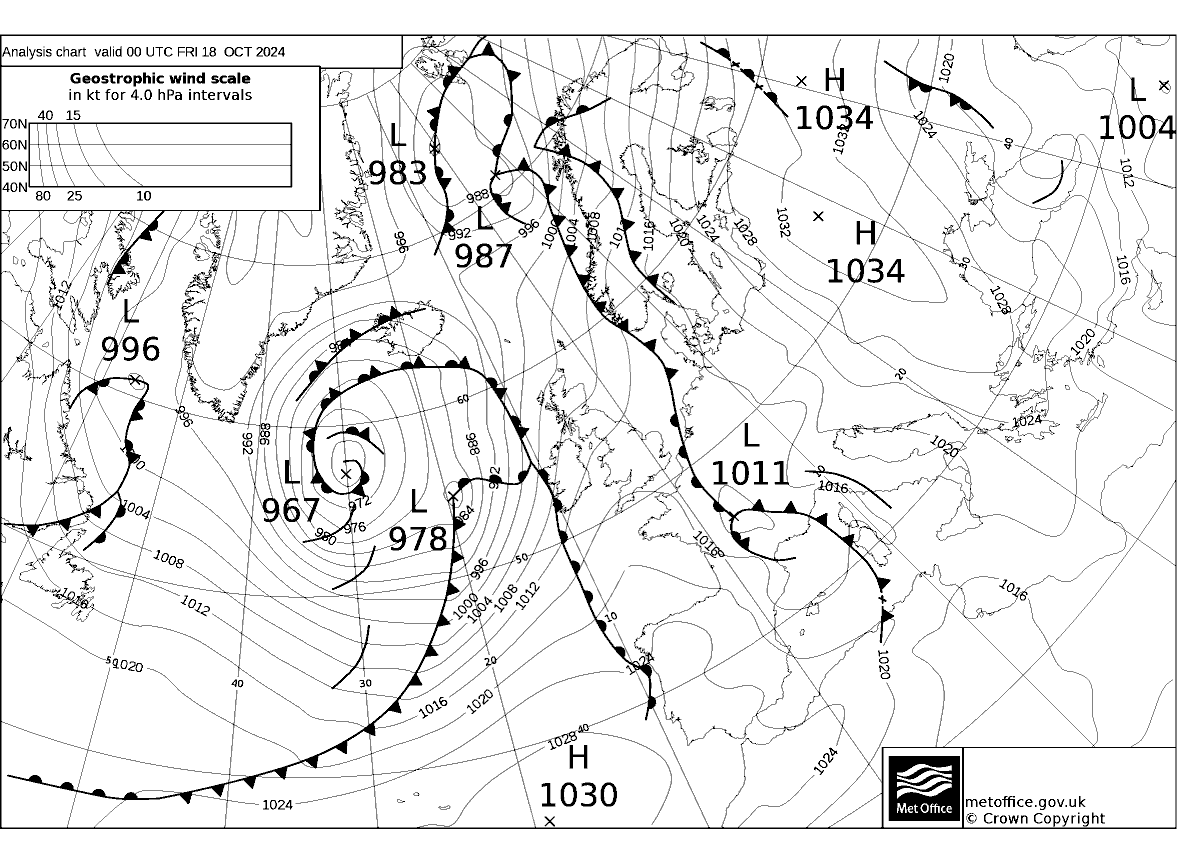
- Analyses
- are headed with the date and time of the analysis. e.g. Analysis chart valid 06 UTC MON 08 MAY 2006
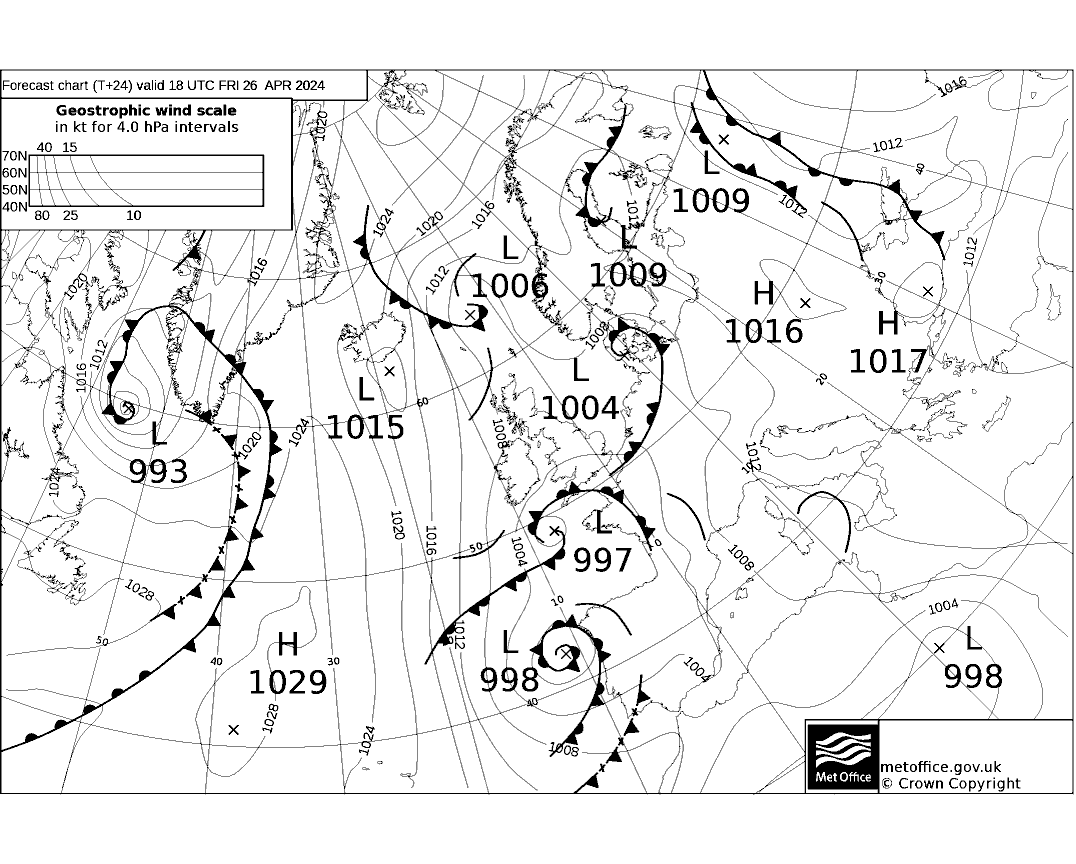
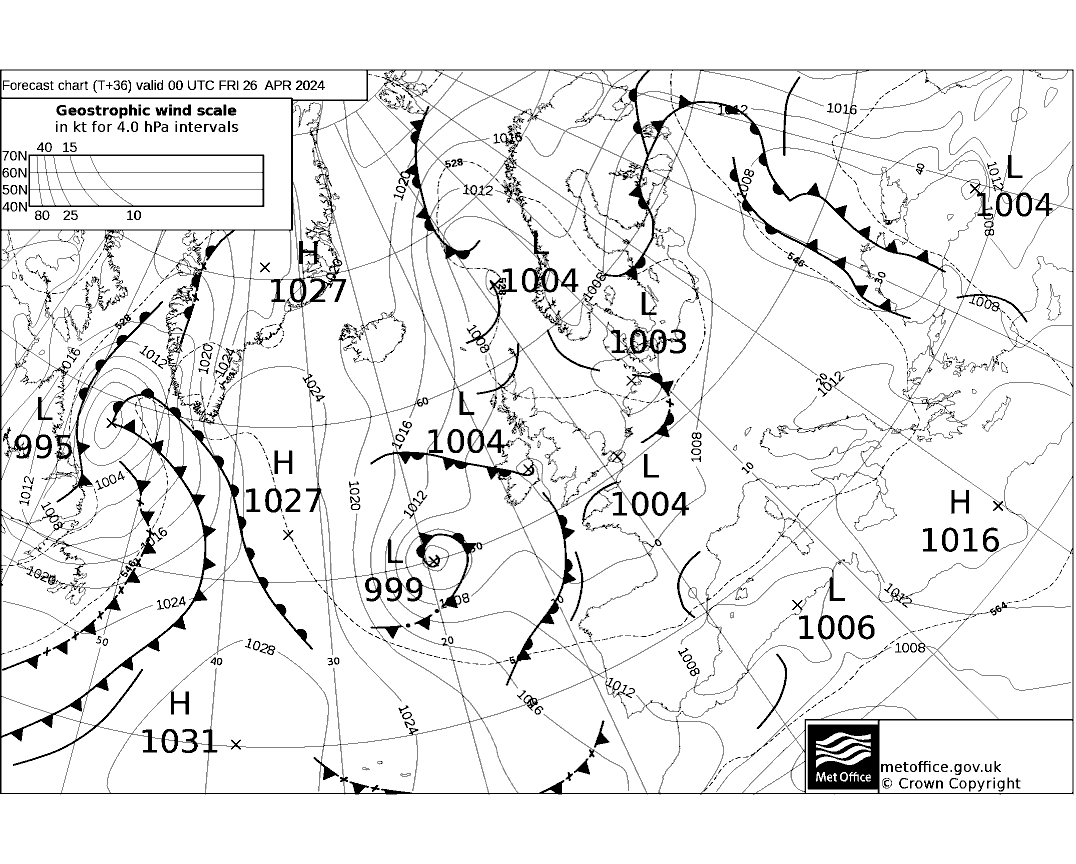
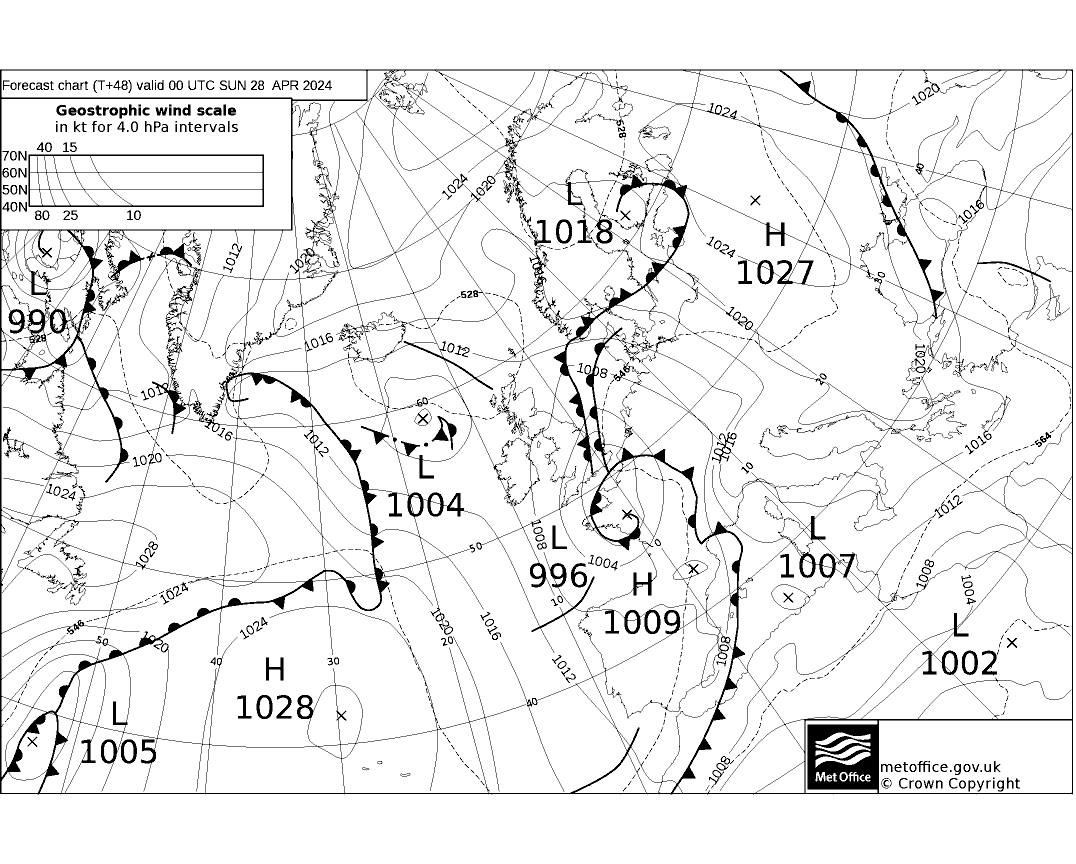
- Forecasts
- are headed with the forecast period
and the date/time at which the forecast verifies.
e.g. 60 hour MSLP & THICKNESS Valid 12 UTC WED 10 MAY 2006.
| A useful guide when comparing two forecasts with the same validity time is to note that the forecast with the lower number of hours ahead is the most recent product. |
The table below may be found useful when one wishes to access a forecast sequence based on a specific data time.
| Earliest times to access the thumbnails to view a forecast sequence based on the same data time | |
| Sequence required | Earliest time to access the thumbnails in the sequence |
| Analysis and a 24-hour forecast product | 0530 1130 1730 2330 UTC |
| Analyses and Forecast products out to T+72H | 0730 1930 |
| Analyses and Forecast products out to T+84H | 0930 (see Note 1) |
| Analyses and Forecast products out to T+120H | 2330 (see Note 2) |
Note 1: If accessing the sequence after 0730 UTC the
Analysis will be for 0600 UTC and the 24-hour forecast charts
also for 0600 UTC.
Note 2: If accessing the sequence after 1930 UTC the
Analysis will be for 1800 UTC and the 24-hour forecast charts also
for 1800 UTC.
Click on a thumbnail to see the associated full size image.